Green growth is seen as a practical tool for achieving sustainable development (Kasztelan, 2017). It is based on the understanding that as long as economic growth remains a predominant goal, a decoupling of economic growth from resource use and adverse environmental impacts is required. "Decoupling" is usually used to mean the possibility of economic growth that takes place simultaneously with a fall in environmental pressure. In other words, the concept of decoupling was introduced to measure and analyze the controversial trade-off between economic development and environmental sustainability; in particular, several empirical studies concern the construction and use of decoupling indicators (Tarabusi & Guarini, 2018).
Indicators
On the other hand a widely used indicator for measuring environmental pressure is the Net Greenhouse Gas Emissions (NGG). According to Eurostat, this indicator measures total national emissions including international aviation of the so called ‘Kyoto basket’ of greenhouse gases, including carbon dioxide (`CO_2`), methane (`CH_4`), nitrous oxide (`N_2 O`), and the so-called F-gases (hydrofluorocarbons, perfluorocarbons, nitrogen triflouride (`NF_3`) and sulphur hexafluoride (`SF_6`) from all sectors of the GHG emission inventories (including international aviation and indirect `CO_2`).
Dataset & Method
For our analysis, we will use the datasets for indicators in the time periods 2000-2009 and 2010-2019 for the European Countries. Both datasets for Real GDP per capita and Net Greenhouse Gas emissions (`CO_2`, `N_2 O`, `CH_4`, `HFC`, `PFC`, `SF_6`, `NF_3`) comes from Eurostat (sdg_08_10 and sdg_13_10). For a given country at time j, let `Y_j` be the Real GDP per capita, `H_j` the level of environmental pressure. The respective variation rates with respect to time `j + n` are:
- `y = \frac{Y_(j+n) - Y_j}{Y_j} => y = \frac{Y_(j+n)}{Y_j} - 1`
- `h = \frac{H_(j+n) - H_j}{Y_j} => h = \frac{H_(j+n)}{H_j} - 1`
Results
 |
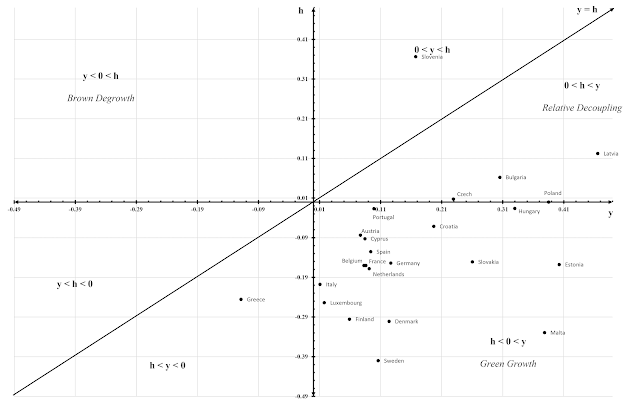
| Figure 1: Combinations (x, y) of countries, for the time period 2000 - 2009 [Own Processing] |
 |
| Figure 2: Combinations (x, y) of countries, for the time period 2010 - 2019 [Own Processing] |
Observing Figure 2, we can easily understand that there are no dramatic changes. Most of European Countries are again in the absolute (green growth) or relative decoupling stage. Analytically, Latvia, Bulgaria, Czech, and Poland are in the Relative Decoupling Stage (`h < y` and `h > 0`). Lithuania's and Slovenia's environmental pressure is higher than the economic growth of this period (`y < h` and `y> 0`). In Green Growth Stage are Portugal, Hungary, Croatia, Austria, Cyprus, Spain, Belgium, France, Germany, Slovakia, Estonia, Netherlands, Italy, Luxembourg, Finland, Denmark, Malta, and Sweden in the last decade (`h < y`, `h < 0` and `y > 0`). Unfortunately, Greece's economic growth is negative and hopefully higher than environmental pressure (`h < y` and `y < 0`).
Table of Data
| Country | 2000 - 2009 | 2010 - 2019 | ||
| Environmental Pressure (h) | Economic Growth (y) | Environmental Pressure (h) | Economic Growth (y) | |
| Austria | 0.1481 | 0.0984 | -0.0833 | 0.0769 |
| Belgium | -0.1959 | 0.0940 | -0.1600 | 0.0825 |
| Bulgaria | 0.2245 | 0.6622 | 0.0625 | 0.3051 |
| Croatia | 0.1667 | 0.3450 | -0.0612 | 0.1970 |
| Cyprus | -0.0382 | 0.1699 | -0.0924 | 0.0842 |
| Czech | -0.1007 | 0.3081 | 0.0078 | 0.2290 |
| Denmark | -0.1507 | 0.0244 | -0.3008 | 0.1239 |
| Estonia | 0.0101 | 0.4284 | -0.1575 | 0.4024 |
| Finland | -0.3670 | 0.1193 | -0.2952 | 0.0590 |
| France | -0.1667 | 0.0456 | -0.1600 | 0.0857 |
| Germany | -0.1181 | 0.0578 | -0.1538 | 0.1265 |
| Greece | -0.0508 | 0.2249 | -0.2453 | -0.1186 |
| Hungary | -0.1507 | 0.2453 | -0.0161 | 0.3297 |
| Ireland | -0.2350 | 0.0893 | -0.1161 | 0.6384 |
| Italy | -0.1474 | -0.0303 | -0.2073 | 0.0108 |
| Latvia | -6.0000 | 0.6705 | 0.1224 | 0.4655 |
| Lithuania | 0.3793 | 0.6673 | 0.6176 | 0.5525 |
| Luxembourg | 0.1013 | 0.1308 | -0.2538 | 0.0177 |
| Malta | -0.0494 | 0.1389 | -0.3291 | 0.3783 |
| Netherlands | -0.1088 | 0.0884 | -0.1679 | 0.0912 |
| Poland | 0.0000 | 0.4062 | 0.0000 | 0.3851 |
| Portugal | -0.2237 | 0.0296 | -0.0169 | 0.0989 |
| Slovakia | -0.0139 | 0.5283 | -0.1507 | 0.2601 |
| Slovenia | -0.0484 | 0.2568 | 0.3667 | 0.1673 |
| Spain | -0.1477 | 0.0764 | -0.1250 | 0.0938 |
| Sweden | -0.1875 | 0.1198 | -0.4000 | 0.1059 |
Selected References
- Kasztelan, A. (2017). Green Growth, Green Economy and Sustainable Development: Terminological and Relational Discourse. Prague Economic Papers, 26(4), 487-499. https://doi.org/10.18267/j.pep.626
- Tarabusi, C., & Guarini, G. (2018). An axiomatic approach to decoupling indicators for green growth. Ecological Indicators, 84, 515-524. https://doi.org/10.1016/j.ecolind.2017.07.061
![[headerImage] [HeaderImage]](https://www.openaccessgovernment.org/wp-content/uploads/2019/09/greconomy.jpg)
Great!! Thank you for sharing your way of thinking!
ReplyDeleteCongratulations!
ReplyDelete